A practical guide to reading the table, spotting opportunities, and acting safely.
What you see in the Matrix
The Matrix lists pairs as rows and exchanges as columns. Each cell shows a Bid and an Ask (or a compact stacked view).
Cells briefly flash green on upticks and red on downticks.
Extra columns (if enabled):
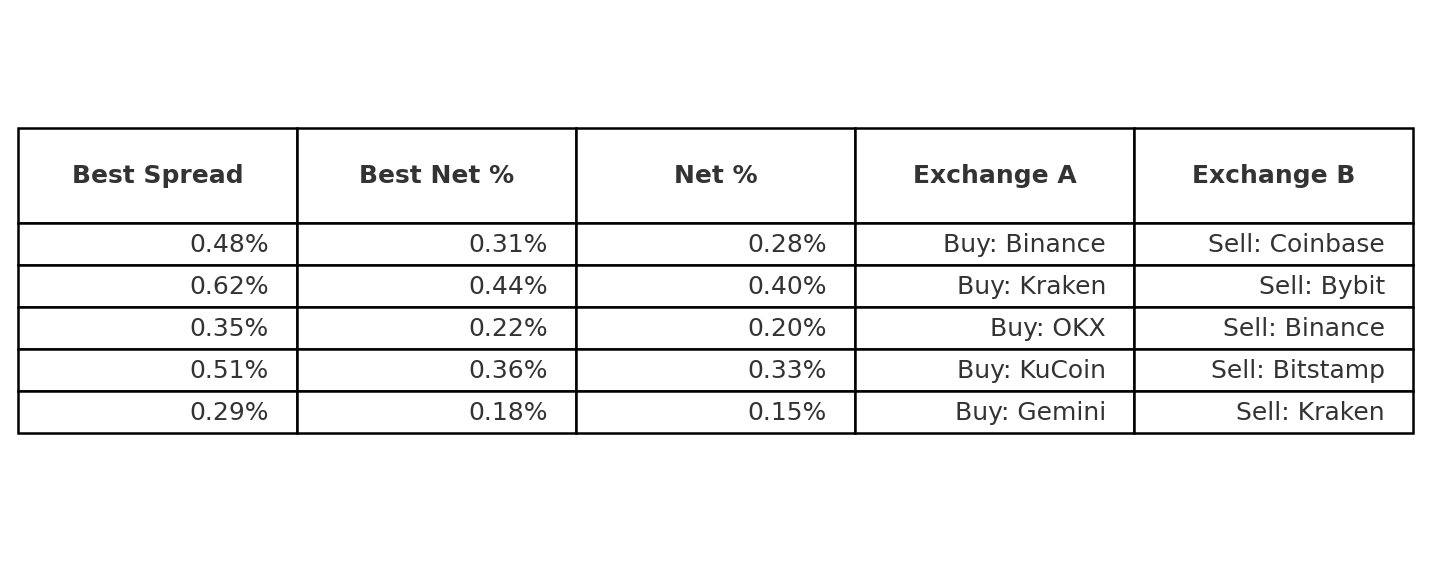
- Best Spread — gross difference between the highest Bid and the lowest Ask across exchanges for a pair.
- Best Net % — spread after estimated fees and an optional position size assumption.
- Δ Net % — change of Net % within your configured window.
Columns & calculations
Let AskbuyEx be the best ask on the buy exchange, and BidsellEx the best bid on the sell exchange.
Gross % = (BidsellEx − AskbuyEx) / AskbuyEx × 100
Net % ≈ Gross % − taker_fee(buyEx) − taker_fee(sellEx) − withdrawal_cost(buyEx)/position × 100
If Net % > 0, there may be a tradable edge, subject to liquidity and limits.
How to spot an opportunity
- Pick a pair (e.g.,
ETH/USDT) and look at Best Net %. If it’s > 0%, identify the cheapest seller (lowest Ask) and the best buyer (highest Bid). - Confirm both venues are available to you (KYC tier, funding, no maintenance), and the books are deep enough for your size.
- Use Δ Net % to sense momentum: rising values suggest improving conditions; falling values warn of decay.
Worked examples
Example A — Simple cross‑exchange spot
- Pair: BTC/USDT
- Buy on Exchange A (lowest Ask):
Ask = 60,000.00 - Sell on Exchange B (highest Bid):
Bid = 60,240.00
Gross % = (60,240 − 60,000) / 60,000 × 100 = 0.40%
Assume taker fees 0.10% each side and no withdrawal movement.
Net % ≈ 0.40 − 0.10 − 0.10 = 0.20%
Action: Buy BTC on Exchange A, simultaneously sell the same amount on Exchange B. Rebalance later.
Example B — Including a withdrawal fee
- Pair: ETH/USDT
- Buy on Exchange X:
Ask = 2,500.00 - Sell on Exchange Y:
Bid = 2,515.00 - Gross % = (2,515 − 2,500) / 2,500 × 100 = 0.60%
Taker fees: 0.12% (X), 0.10% (Y). Withdrawal from X costs 0.0005 ETH. If position = 10 ETH:
Withdrawal in % ≈ 0.0005 / 10 × 100 = 0.005%
Net % ≈ 0.60 − 0.12 − 0.10 − 0.005 = 0.375%
Illustrative schema
The diagram below illustrates the columns you’ll typically act on. Values are for demonstration only.

If you prefer a separate file, download the PNG and upload to your Media Library, then replace the image URL:
Action playbook
- Confirm readiness: accounts verified, API keys configured (if needed), funds available, limits checked.
- Pick an opportunity: Best Net % > 0 on your target pair.
- Size your trade: confirm depth is sufficient; avoid heavy slippage.
- Execute: taker BUY on the lowest Ask; taker SELL on the highest Bid (or use maker orders if acceptable).
- Rebalance & log: restore neutral balances; record realized net % and slippage.
Fees, risks & caveats
- Fees: your actual fees may differ from estimates; adjust settings for accuracy.
- Latency: windows decay quickly; execution must be fast.
- Liquidity: thin books → slippage; check depth.
- Venue limits: KYC tiers, transfer limits, maintenance windows.
- Compliance: follow local laws and exchange terms. This is not financial advice.